Issue 1: Rates Review for a fairer distribution of rates
Consultation has concluded
Should we change the way we share rates across our district?
As part of this Long Term Plan Amendment we're asking whether you think we should change the way we share rates across the district. With the cost of living high and the inflation rate sitting at a 35 year high, affordability of household expenses, including rates is front of mind for everyone, including Council.
With 25% of our population aged 65 and over, our households earning on average 35% less than the rest of NZ per year according to Stats.nz, and some of the highest proportions of mortgages and rent comparative to income in Aotearoa, our community are feeling the pinch more than most.
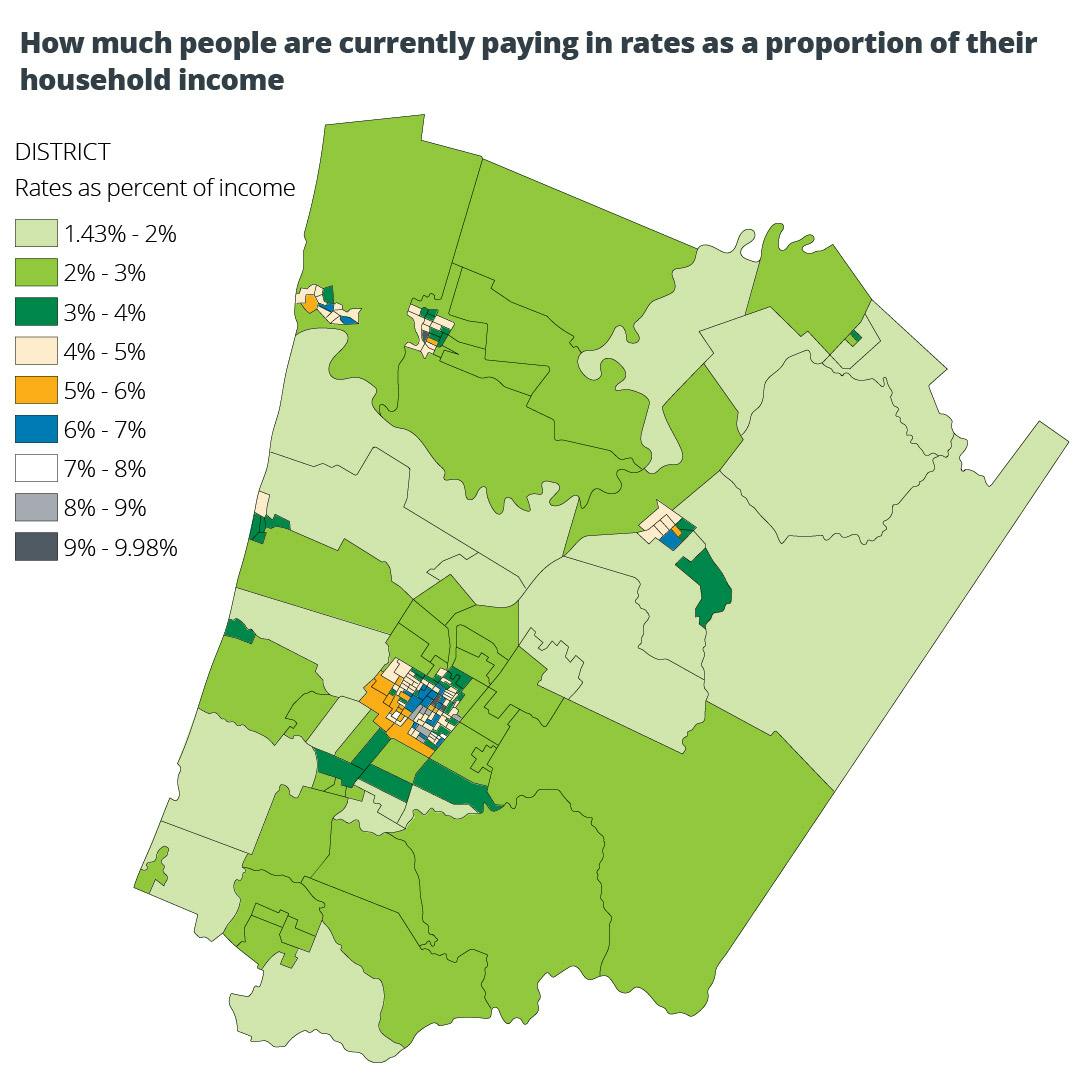
An Independent Inquiry into Local Government Rates in 2007 produced the 'Shand report' which suggested that rates shouldn't be more than 5% of a household's income. In Horowhenua we have some households, particularly in lower-income areas, like Foxton, Levin Central and Shannon, paying 8-9 percent of their income on rates. Others pay 1-2%. While there are different reasons for this, it doesn't seem fair or equitable.
Our district has a wide range of demographics and income levels, with many in our community on low incomes and further challenged by the cost of living crisis. Here are some numbers for our district:
- Average income is 35% lower than nationwide (2018 Census)
- Renters spent an average of 40% of their income on rent in 2021 (Dot loves Data)1 – the highest proportion in NZ
- Renters in Foxton spent an average of 45% of their income on rent in 2021. In Shannon it was 51%.
- Those with a mortgage paid an average of 43.9% of their income on mortgage payments in 2022.
How much people are currently paying in rates as a proportion of their household income?
 | Recent research helped better understand the affordability challenges in different parts of the district. As a benchmark, we used the thresholds recommended by the Shand report – not more than 5% of household income spent on rates. The results are illustrated on this map using median income levels from the last census data from March 2018, updated for the labour cost index movement to March 2022, and the median rates data for 2022/23. |
What can Council do to ensure that rates are shared more fairly and equitably across the district?
How our rating system works?
Our rating system is currently made up of nine individual charges, some fixed and some differing according to property values. Added together, these charges make up your rates bill from the Horowhenua District Council. Currently, charges based on land value make up almost 25% of the rates we collect and fixed charges make up about 60%. This means that owners of lower-value homes can have rates bills that are similar to those of owners of much higher-value properties. We believe it would be fairer to shift that proportion, so more of our rates are based on the value of your land and building, and reduce the costs of fixed charges.
As we're not able to rate based on household income data, Capital Value is the closest indicator of wealth we have. So this poses the question, would rating properties based on their Capital Value see a more equitable distribution of rates? Equally, for those properties that may have a small Land Value, but significant Capital Value, for example a utility provider or some of our rural properties, does using Land Value to rate these properties seem fair and equitable?
Making changes to the way we share rates doesn't affect the total amount of rates we collect. This means that for those ratepayers who receive a decrease in rates as a result of any change, there will be others that see an increase. It also makes it really important that we understand the impacts any change may have, and ensure that the guiding philosophy of fairness and equity guides decision-making.
Property revaluations must be factored in
The August 2022 property revaluations have to be included in the options. The Rating Valuation Act 1988 says valuations for each ‘rating unit (basically, a property) have to be updated every three years. These revaluations are the largest driver in the rates increase by property type and account for the large increases in both land and capital value we’ve seen over three years. Urban properties have experienced the greatest increases.
Our proposed change
We are proposing to change how we calculate the district-wide general rates from based on land value to based on capital value – the value of both your land and your building.


Rating DatabaseYou can find your Proposed (indicative) Rates for the 2023/2024 Rating Year on the Rating Database. Simply enter a Street Address or VG Number to search the Horowhenua District Council Rating Information Database for property rates. |
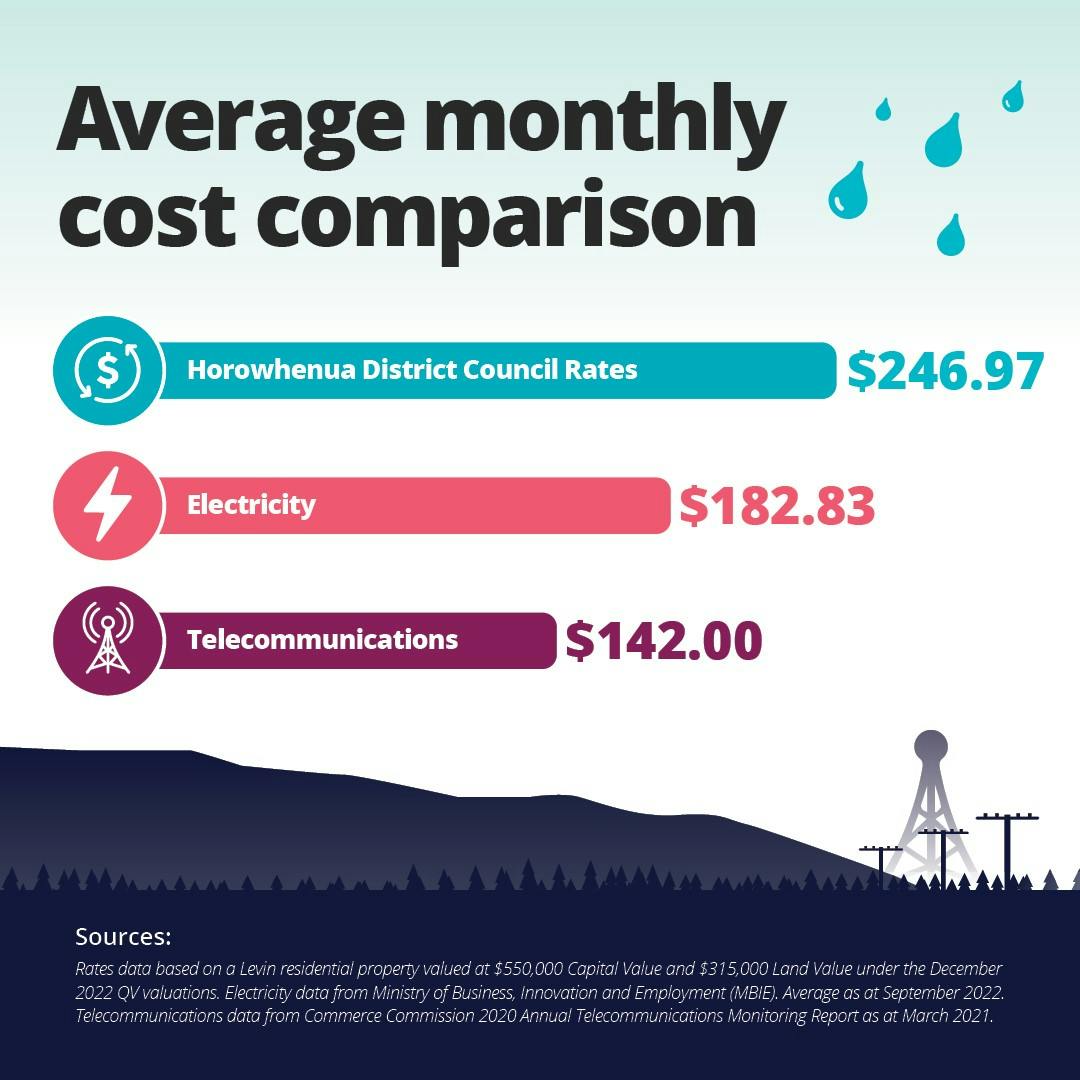
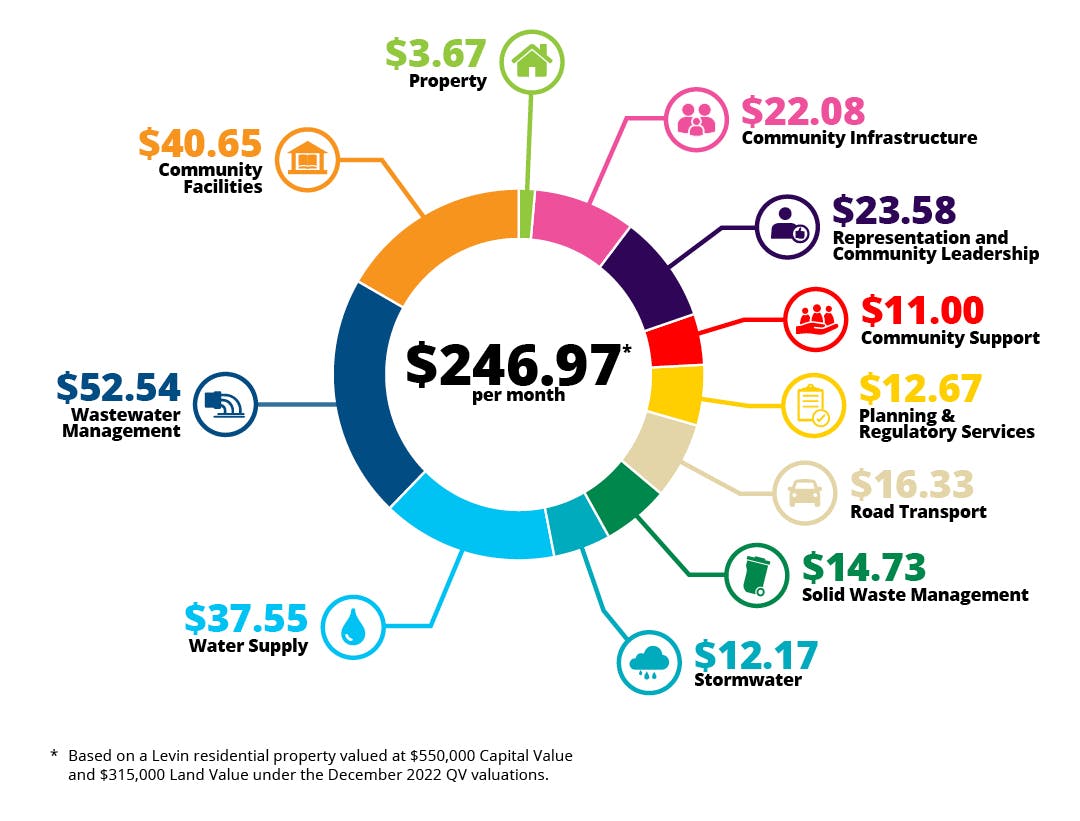
Where do your rates go?We've used a Levin residential property valued at $550,000 Capital Value and $315,000 Land Value under the 2022 QV valuations as an example to show where your monthly rates bill goes. Many of the services Council provides are things we don't think twice about using, but your rates go to things like our libraries and the books you read, the roads you drive on, the playgrounds and reserves you take your kids or furbabies to and the help that we provide if there is ever an emergency. |  * Based on a Levin residential property valued at $550,000 Capital Value and $315,000 Land Value under the December 2022 QV valuations * Based on a Levin residential property valued at $550,000 Capital Value and $315,000 Land Value under the December 2022 QV valuations |
This year’s rates
When the LTP 2021-2041 was developed, we expected that we would need a 6.4% rates revenue increase and set a limit of 6.5% for the total rates revenue increase. However, things have changed.
This year’s rates increase is being driven by costs outside of our control – insurance, interest rates, depreciation and contract rate increases. This means that even before doing any work this year we need an 8.2% rate increase to cover costs. To fund this increase, we will need to borrow, increase rates or both.

Option 1
7.9% rates increase (Council’s preferred option)
This is Council’s preferred option. We believe this option is financially responsible. It lets us deliver the basic services and projects we committed to through the current LTP, without taking on an unmanageable level of debt. Under Option 1, we will not reduce any levels of service, but will not provide new or improved services.

Option 2
A rates increase less than 7.9%
We do have the option of a rates increase of lower than 7.9%, which would require cuts to the level of services we provide. You can see below how cutting a service will impact rates. While our preferred option is one that does not reduce any Levels of Service we provide to our community, we are providing an option for you to tell us if you’d prefer rates to be lower than 7.9%. You can see examples below how cutting a service will impact rates.

Submissions closedFurther information on all issues and topics can be found in the LTP 2021-2041 Amendment and Annual Plan 2023/24 Consultation Document. Submissions to the LTPA and Annual Plan closed at 4pm on Monday 1 May 2023. Hearings will take place on 10-11 May 2023 followed by deliberations on 31 May & 1 June 2023. Council will receive all submissions before this to inform that discussion and subsequent decisions. Elected Members will adopt the final Long Term Plan Amendment and Annual Plan on 28 June 2023. |

Key Documents
-
 LTPA 2021-41 and AP 23-24 Consultation Document |He Wharangi Uiui (7.03 MB) (pdf)
-
 Supporting Information
-
HDC LTPA 2021-41 and AP 23-24 Supporting Information - Draft Fees and Charges (430 KB) (pdf)
-
HDC LTPA 2021-41 and AP 23-24 Supporting Information - Draft Infrastructure Strategy 2021-2051 (7.06 MB) (pdf)
-
HDC LTPA 2021-41 and AP 23-24 Supporting Information - Draft Significant Forecasting Assumptions (941 KB) (pdf)
-
HDC LTPA 2021-41 and AP 23-24 Supporting Information - Draft Financial Statements (1.08 MB) (pdf)
-
HDC LTPA 2021-41 and AP 23-24 Supporting Information - Draft Financial Strategy (393 KB) (pdf)
-
HDC LTPA 2021-41 and AP 23-24 Supporting Information - Draft Council Controlled Organisations (86.2 KB) (pdf)
-
HDC LTPA 2021-41 and AP 23-24 Supporting Information - Draft Definitions and Interpretations (104 KB) (pdf)
-
HDC LTPA 2021-41 and AP 23-24 Supporting Information - Draft Activity Statements (5.75 MB) (pdf)
-
HDC LTPA 2021-41 and AP 23-24 Supporting Information - Draft Development Contributions Policy 2021 (2.02 MB) (pdf)
-
HDC LTPA 2021-41 and AP 23-24 Supporting Information - Draft Working with Māori (557 KB) (pdf)
-
HDC LTPA 2021-41 and AP 23-24 Supporting Information - Draft Policies (1010 KB) (pdf)
-